Databases & workflows
Organized records, smart forms, approvals, document tracking, alerts, audit trails, and clear access controls.
Explore an example →Data · insight · impact
Your needs. Your answers. Your control. We combine field experience, statistics, and custom technology to help you understand what is happening, why it matters, and what you can do next.
Meet CivicEdge · Built on field experienceWho we serve
CivicEdge supports organizations at every level with practical analytics, technology, research, and operational solutions tailored to their responsibilities, people, and communities.
Customized Dashboard Interactive Area
Start with one clear view, then customize the measures, charts, colors, filters, alerts, maps, and layout around the decisions your team needs to make.
Illustrative concept only. All information shown is fictional and generic—not client, agency, employee, case, or operational data.
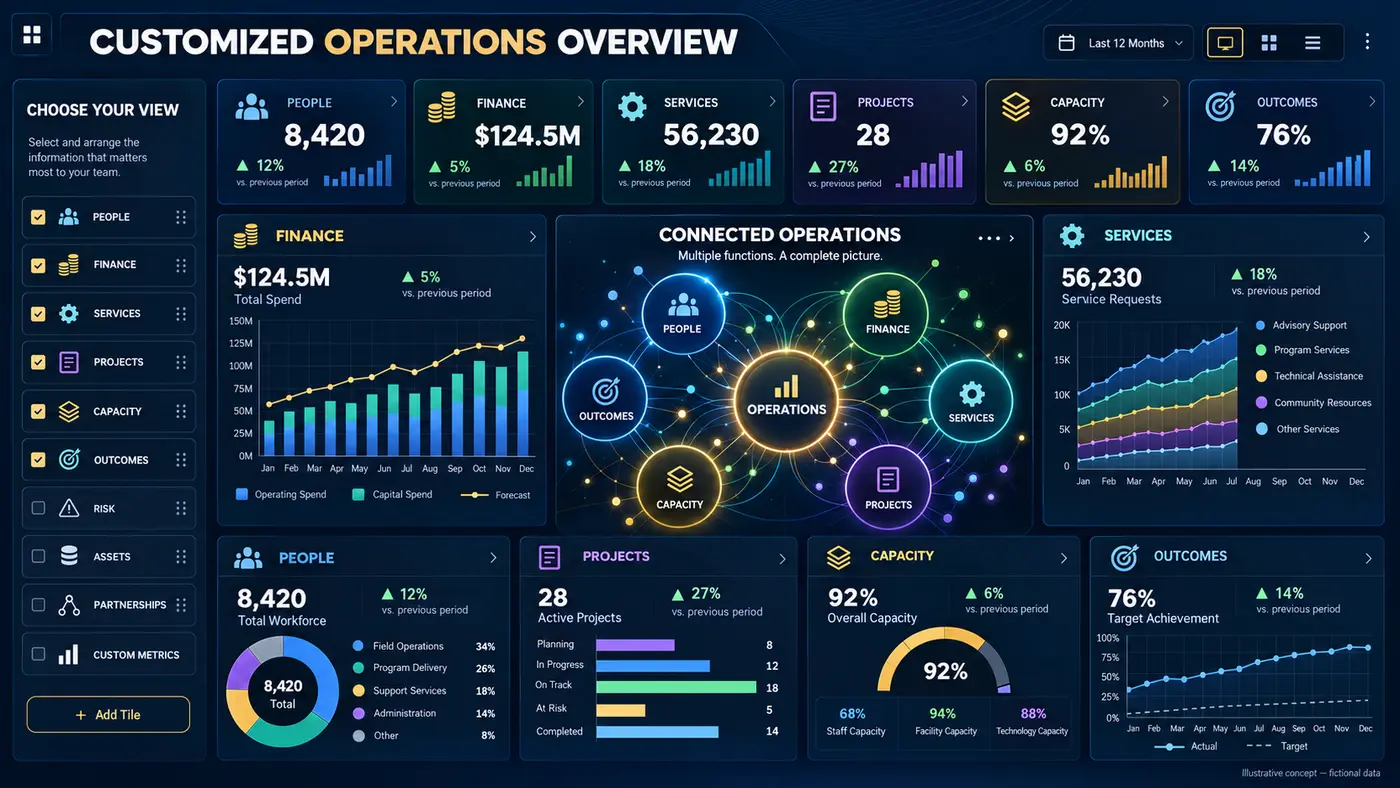 Click to view more dashboard looks →
From outliers to outcomes
Our expertise spans decades of dedicated service across detention operations, finance, executive leadership, and much more. We excel in advanced research, statistics, and data systems, covering nearly every aspect of your agency.
We expertly navigate the complexities of state, federal, and local laws to support unwavering compliance and data integrity. With a deep understanding of budget constraints and decision-making processes, we develop practical, accessible tools that empower stakeholders and deliver meaningful, measurable results.
The goal is to strengthen your team—not make you dependent on ours. Your questions, budgets, workflows, and priorities shape the solution. You receive clear answers, usable tools, documentation, and the knowledge to stay in control. No one-size-fits-all package.
Experience inside the operation
Our expertise spans decades of dedicated service across detention operations, finance, executive leadership, advanced research, statistics, and data systems. We understand the laws, budget constraints, and decisions behind the numbers—and build accessible tools that protect data integrity, support compliance, and help stakeholders act with confidence.

Clearer processes. Better information. More accountable decisions.
Photo: Ammodramus · Public domain
Field-informed tools for staffing, workload, resources, and safety.
Historic Alcatraz · Addictivephotographer · CC BY-SA 3.0Displayed with a responsive crop.

Connect services, budgets, and outcomes across the organization.
Seattle · katdavis733 · CC0Illustrative locations—not client facilities or endorsements.
What CivicEdge builds
We map the work, connect the data, and build practical systems around the way your organization actually operates.
Organized records, smart forms, approvals, document tracking, alerts, audit trails, and clear access controls.
Explore an example →Executive, command, finance, patrol, detention, HR, program, and public-facing views.
Explore dashboard looks →Bayesian estimation, probabilistic forecasting, program evaluation, network analysis, and optimization.
Try the statistics lab →Connect existing systems, remove repeat entry, standardize reporting, and reduce process delays.
Try a workflow →Budget scenarios, staffing plans, overtime analysis, resource allocation, and operational reporting.
Explore planning tools →Program evaluation, grant support, policy research, executive reports, and evidence-based recommendations.
Discuss your project →Built for control
Replace fragmented files with governed data and clear ownership.
Show how workload, staffing, overtime, service, and budgets affect one another.
Find duplication, delays, and coverage gaps before they become expensive.
Receive usable tools, documentation, and knowledge—not dependency.
Try it yourself · fictional data
Explore how statistics and practical systems turn information into decisions. Every example is customizable to your organization’s data, workflow, and priorities.
Explore uncertainty, forecasts, program evaluation, queues, and connected factors. See the methods and assumptions behind each result.
Open the statistics lab →02 · Put insight to workTry budget, payroll, staffing, patrol, command, detention, pretrial, travel, database, and service-planning tools.
Explore operational solutions →Start with the hardest problem
Begin with one dashboard, one workflow, or a connected operational data system.
About CivicEdge Technologies
Our perspective comes from hands-on experience in detention operations, finance, executive leadership, research, and data systems. We understand that every process affects people, resources, and the mission.
We bring that practical knowledge together with advanced statistics and technology to help organizations solve difficult problems—and retain control of the solutions.

Tools should fit the real shift, workflow, budget, and decision—not an idealized process.
We go beyond counts and percentages to examine patterns, uncertainty, causes, and alternatives.
Clear documentation, practical handoff, and usable systems help you save resources and remain in control.
Interactive experience lab
Every organization, location, person, number, and workflow below is fictional. These concepts demonstrate possibilities—not client systems or agency work products.
Synthetic data · transparent assumptions
Adjust the assumptions to see how evidence changes a decision. These working calculations are educational examples, not validated agency forecasts.
Estimate the share of service requests completed within a target window. A beta prior combines with new binomial evidence.
Gold: prior densityTeal: posterior density
Prior: Beta(a, b), with a = prior mean × prior strength and b = (1 − prior mean) × prior strength. Posterior: Beta(a + successes, b + observations − successes). Assumes independent requests with a common completion probability. Credible limits are numerically integrated on a fixed grid. This illustrates shrinkage; it does not correct selection bias or changing workload.
A lognormal predictive distribution represents positive, right-skewed monthly overtime costs. Adjust the mean, variability, and spending threshold.
Teal: cost density · Gold dashed line: planning threshold · Costs in $000s
For supplied mean m and coefficient of variation c, sigma = √log(1 + c²) and mu = log(m) − sigma²/2. Quantiles use exp(mu + sigma × normal quantile). Tail probability is computed from the normal CDF. No normal cost assumption or observed agency records are used. Parameters are hypothetical; seasonality, dependence, and parameter uncertainty are not included.
Compare average processing days before and after a workflow pilot, alongside a comparison team.
Teal: pilot · Gold: comparison · Dashed: pilot counterfactual
Estimate = (pilot after − pilot before) − (comparison after − comparison before). A causal interpretation requires parallel trends without the pilot, no spillovers, stable group composition, and no differential concurrent changes. Two periods cannot establish parallel trends. No standard errors or significance claims are supplied because record-level data and sampling design are absent.
Fictional scenario · Riverbend Region
Fictional payroll control center
Test how staffing, overtime, specialty pay, and corrections affect the payroll estimate before the pay period closes.
Regular payroll equals employees paid × average regular pay. Overtime equals overtime hours × average overtime rate. Specialty pay is added separately. The review status responds to the number of pending corrections and the overtime share. This fictional illustration does not contain employee records, taxes, benefits, contractual rules, or actual agency thresholds.
Contact us for details on how this live, real-time example works.
Fictional scenario · Northlake City
Preset illustrations, not computed optimal routes. Real deployment requires road travel times, live demand, and service constraints.
Fictional multi-division snapshot
Staffing, demand, safety, fleet, and required learning.
Three units carry both elevated demand and planned absences. Shift two discretionary assignments into the overlap window.
Fictional facility · Cedar Center
Select a housing area, then test how occupancy, available staffing, high-acuity placements, and scheduled movements interact.
Housing A
BalancedThe display combines fictional occupancy, staff availability, high-acuity placements, and scheduled movements into a transparent pressure index. It supports workload and resource planning only; it is not a classification, custody, or individual safety decision tool.
Contact us for details on how this live, real-time example works.
Fictional county · pretrial operations
Explore how active caseload, new referrals, officer availability, and required contacts affect operational workload and timeliness.
Monthly contact requirements are converted to a weekly planning estimate using 4.33 weeks per month. The example compares required and completed contacts and displays current cases per available officer. It does not score individuals, predict behavior, recommend release or detention, or replace legal and judicial judgment.
Contact us for details on how this live, real-time example works.
Fictional configurable workflow
Recommended path
Fictional information architecture
Record_IDKey
Assignment_GroupCategory
Effective_DateDate
Cost_CenterLink
Record_StatusRule
Connect positions, assignments, vacancies, credentials, and labor costs without exposing personal data in executive views.
Your priorities lead the work
We shape the database, dashboards, analysis, and workflows around your needs. Your team keeps the visibility and knowledge to make informed decisions.